
The Office of the Executive Vice Chancellor provides academic leaders and instructors with data, training, and expertise related to teaching and learning, aligned with N2025 goals for degree completion.
Using data can improve student success by facilitating reflection and pedagogical innovation at the level of instructors, learning communities, and departments.
Critical to all students’ success is framing metric use through a lens of demographic differences and engaging instructors and departments in self-reflection to reach the university’s goals.
Data are from the Unizin Data Platform, which combines information from the Registrar and Canvas. Other sources include the Academic Management Information System, managed by the Institutional Effectiveness and Analytics, and the University of Nebraska system's Enterprise Data Solutions.

Utility and Scope
Analytics can be useful in identifying situations in which instructors, courses, or students could use additional support. If systematic reviews of data are suggestive of problems that may require action, a holistic assessment of instruction including peer observations, course materials and structure, and student evaluations should be conducted.
Undergraduate analytics data should not be used in isolation to determine an instructor’s merit increase, retention, promotion, or tenure regardless of appointment type, as such processes can erode the trust necessary for instructor engagement.
For example, an instructor for an introductory course may successfully use pedagogical strategies to reduce demographic differences relative to what they would have been in the absence of such strategies, yet still have the largest differences in a department because of the instructor’s critical role in an introductory course.
Rather than reduce the complexity of teaching and learning to a metric, the utility of undergraduate analytics is to expand the scope of self-reflection and the tools for pedagogical action.
Data Metrics and Dashboards
Many of the resources below are accessed within Tableau, which requires users to be on the campus network or using the university's VPN.
To receive viewing permissions and/or request customized reports for individual colleges and departments, contact Chad Brassil, faculty director for undergraduate analytics.
Colleges and Departments
- Undergraduate Analytics/Community are Tableau dashboards for faculty and staff with an interest in undergraduate success and include the following:
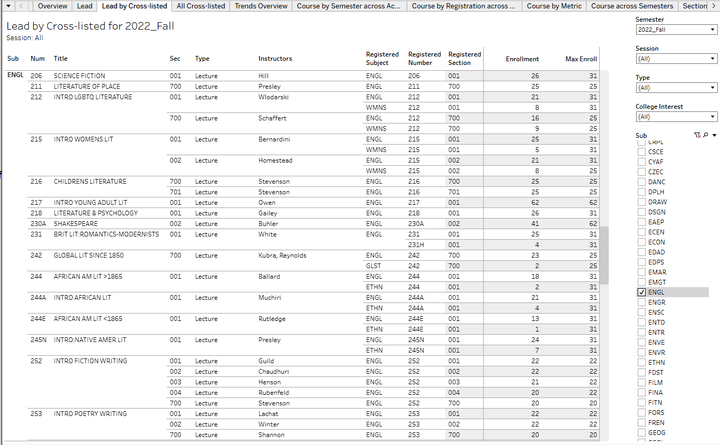
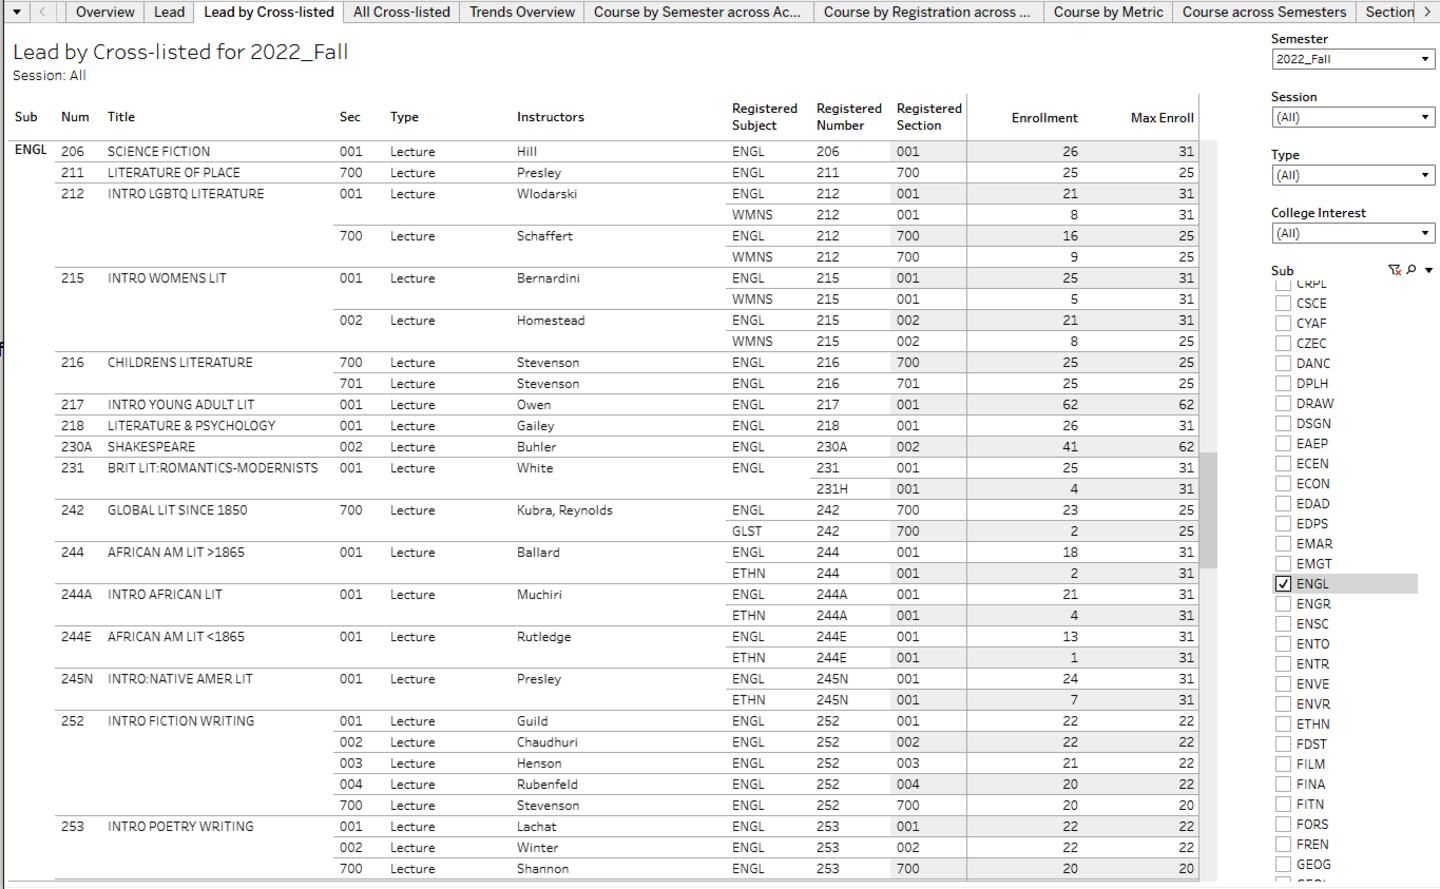
- Combined Course Enrollments shows course enrollment numbers across all cross-enlisted course codes to reflect the actual student enrollment in a course from an instructor perspective. Cross-listed courses are listed by their lead (or primary) course subject and number. The first set of tabs is designed for real-time viewing of enrollment. The second set of tabs is designed to view historical trends in enrollment.
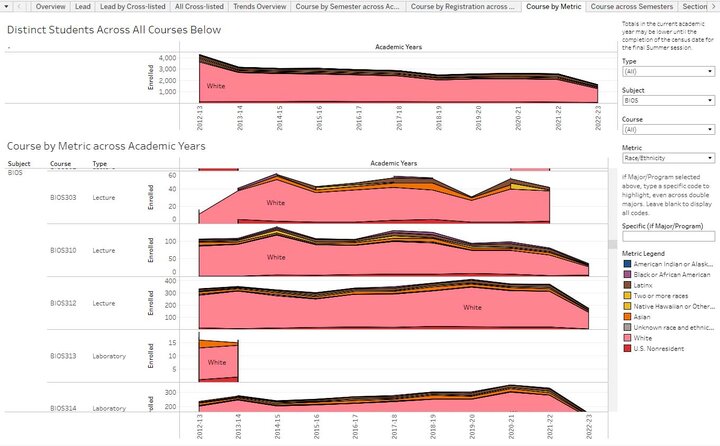
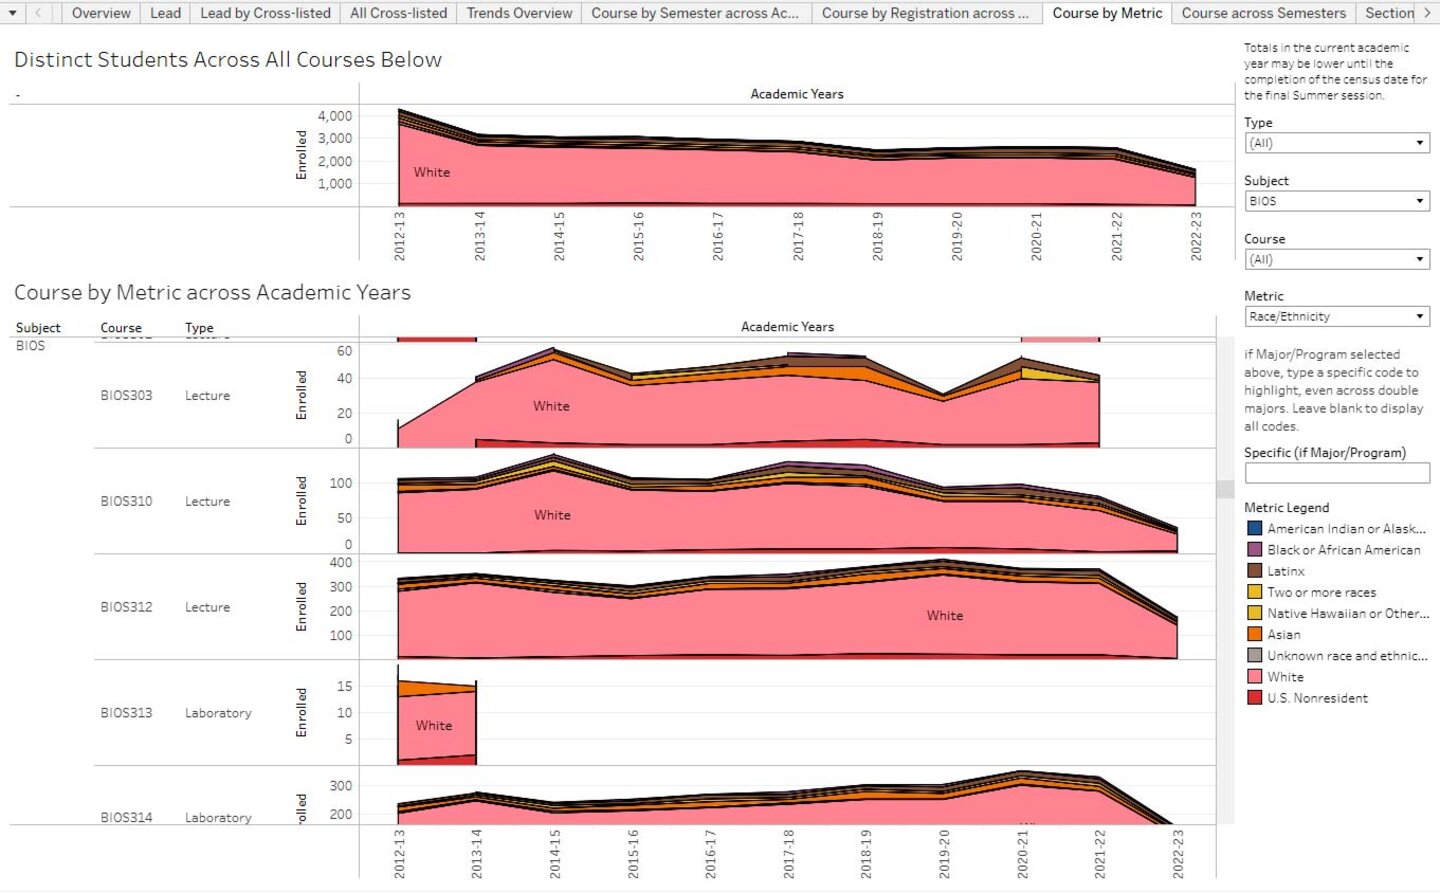
- The Course by Metric tab shows demographic trends in courses across time, including showing all majors regardless of the order a student declares for a double-major.
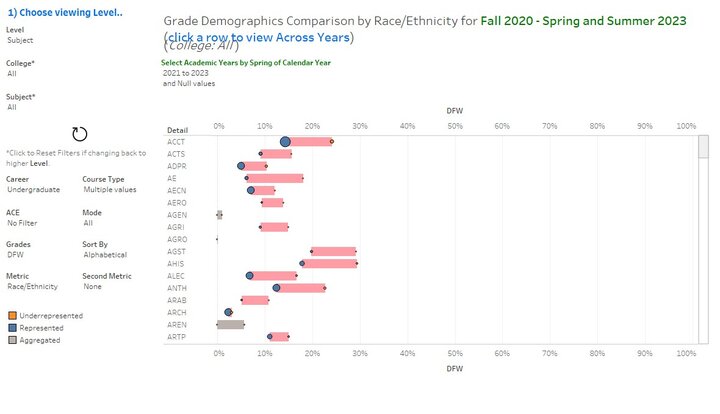
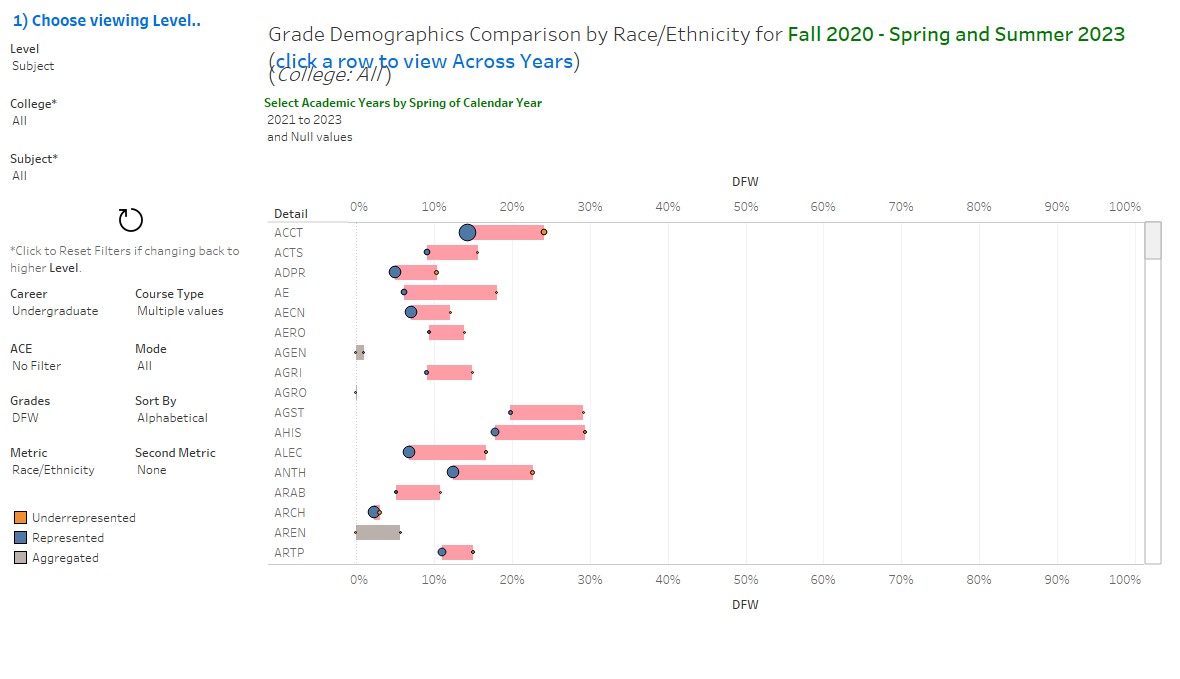
- Grade Demographics By Level shows demographic differences in course DFW rates by race/ethnicity and first-generation status. DFW equity gaps can be viewed at the level of a subject-number or at the 100-level, 200-level, etc.
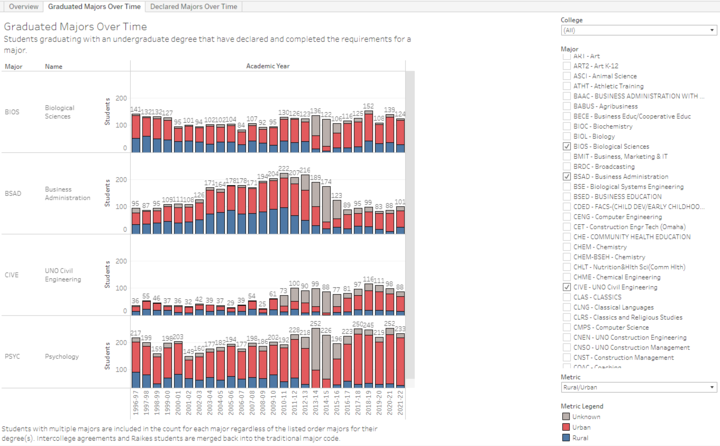
- Majors shows graduate or declared majors over time. Demographics within a major includes race/ethnicity, generation, gender, age, double majors, transfer/first-time, starting college, starting first major. Students are included regardless of the order in which they declared their major and students participating in intercollege agreements or the Raikes program are placed within their major.
- SCH by Instructor's Primary Unit shows student credit hours attributed to the college of instructors. Detail allows increasing levels of resolution to be selected. Course Allocations shows how the SCH for a given course is distributed across colleges. Instructor by Calendar Year rearranges the information for use in annual instructor performance reviews.
- SCH by Registration Code across Time shows student credit hours for a department by registration code. Additional ways of visualizing departmental SCH are available upon request.
- Combined Course Enrollments shows course enrollment numbers across all cross-enlisted course codes to reflect the actual student enrollment in a course from an instructor perspective. Cross-listed courses are listed by their lead (or primary) course subject and number. The first set of tabs is designed for real-time viewing of enrollment. The second set of tabs is designed to view historical trends in enrollment.
- Course to Course can be used to explore a variety of questions about how student performance in one course is related to student performance in another course.
Instructors
- My Courses Reports: Key Student Attributes enables instructors to examine historical grades in their courses. To view disaggregated by demographic metrics, choose Primary Course, then choose Attribute of Interest: Race Ethnicity, First Generation, Sex, or Pell Eligibility.
- Course Insights is available in the left menu within Canvas:
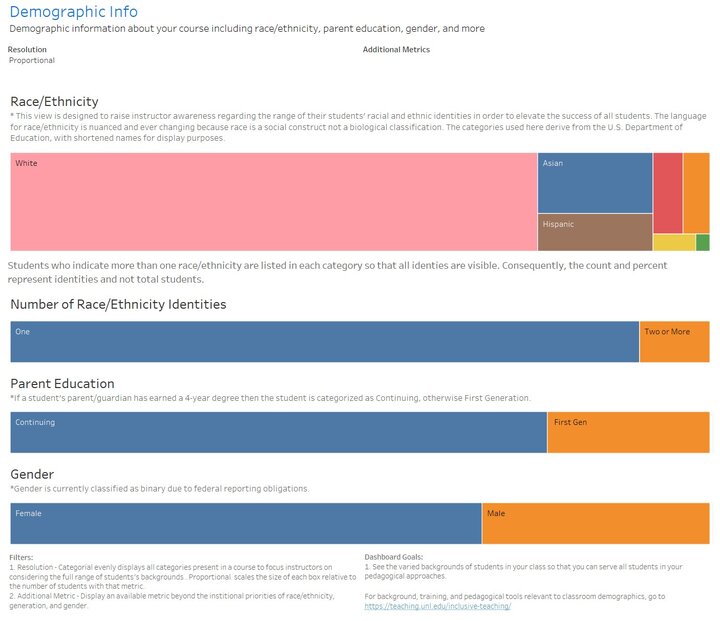
- The Demographic Info dashboard provides instructors with a visualization of the demographics within their course. The emphasis is on race/ethnicity, first-generation status, and sex. Instructors can choose from a drop-down menu to additionally display information on the students in their class aggregated by major, state of residency, current UNL GPA, and class standing. The default view of this dashboard is categorical, which equally weighs the representation of all categories of students in the class. This visualization aids an instructor in equally viewing the importance of each student identity in the course. Proportional can also be chosen, which sizes each box by the proportional representation of that group in the course.
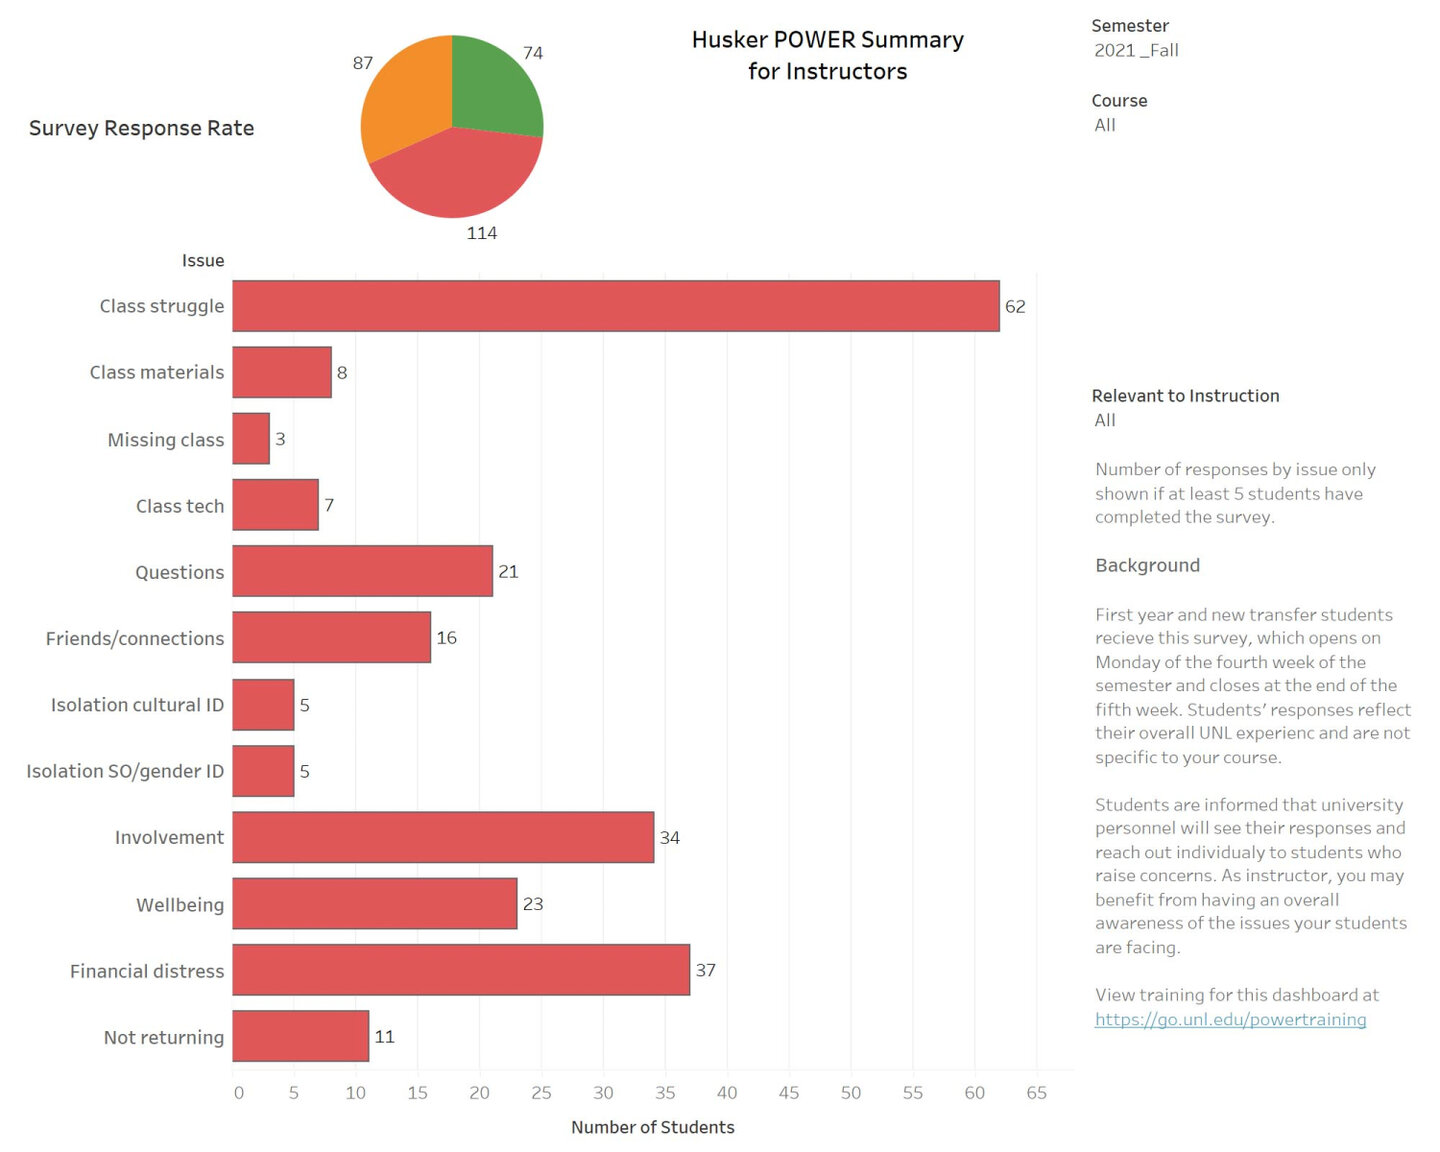
- Husker Student POWER Summary of Instructors is designed for instructors of first-year students to view completion rates of the Husker Student POWER Survey and aggregated summary information.
- Husker Student POWER Survey for Instructors is designed for instructors who have completed training on using the Husker Student POWER Survey and have requested student-level responses as part of their plan to assist students.
Special Interest
- CEHS 14 Dimensions Rubric Results is a customized dashboard for the College of Education and Human Sciences that summarizes the rubric results entered in Canvas for a set of courses evaluated using the 14 Dimensions Rubric for purposes of accreditation. Similar dashboards to summarize outcomes from rubrics across a set of courses for colleges or departments are available upon request.
- Student Athlete Courses and College is a customized for the colleges of Journalism and Mass Communications and Business for reporting to Athletics which courses and majors have student athletes enrolled. Additional colleges can be included in this report upon request.
- William H. Thompson DFW provides a view of DFW rates for WHT courses over time or disaggregated by race/ethnicity, gender, and first-generation status. Data can be viewed in comparison to non-WHT sections of the same course.
University Wide
- University of Nebraska-Lincoln Fact Book is the official source of UNL statistics, maintained by Institutional Effectiveness and Analytics.
- Achievement-Centered Education DFW provides a view of DFW rates for ACE courses over time or disaggregated by race/ethnicity, gender, and first-generation status. Data can be viewed per course or in comparison across all courses in a given ACE outcome.
- GTA Instructors is designed to provide Graduate Studies a list of graduate students with contact emails who have been added to Canvas as teachers or teaching assistants and/or graduate students who have a GTA appointment.

Responses, Interventions, and Professional Development
Undergraduate analytics data and dashboards can compel change, and that change requires thought and support. Below are resources that help support instructors and academic leaders.
UNL Resources
- Center for Transformative Teaching
- Discipline-Based Education Research Seminar Series
- Non-discriminatory Pedagogy in the Natural Sciences Resource
- Teaching@UNL Canvas Course
- X-DBER Conference